home

Alternate Timeline: Winning Here
Winning here is an alternate timeline where the Liberal Democrats manage to reverse the decline of the Liberal Party
in the early 20th Century, and rise to replace Labour as the main centre left political party of the United Kingdom
I created it as a joke because i thought it'd be funny to make Jo Swinson the Prime Minister
Election Results
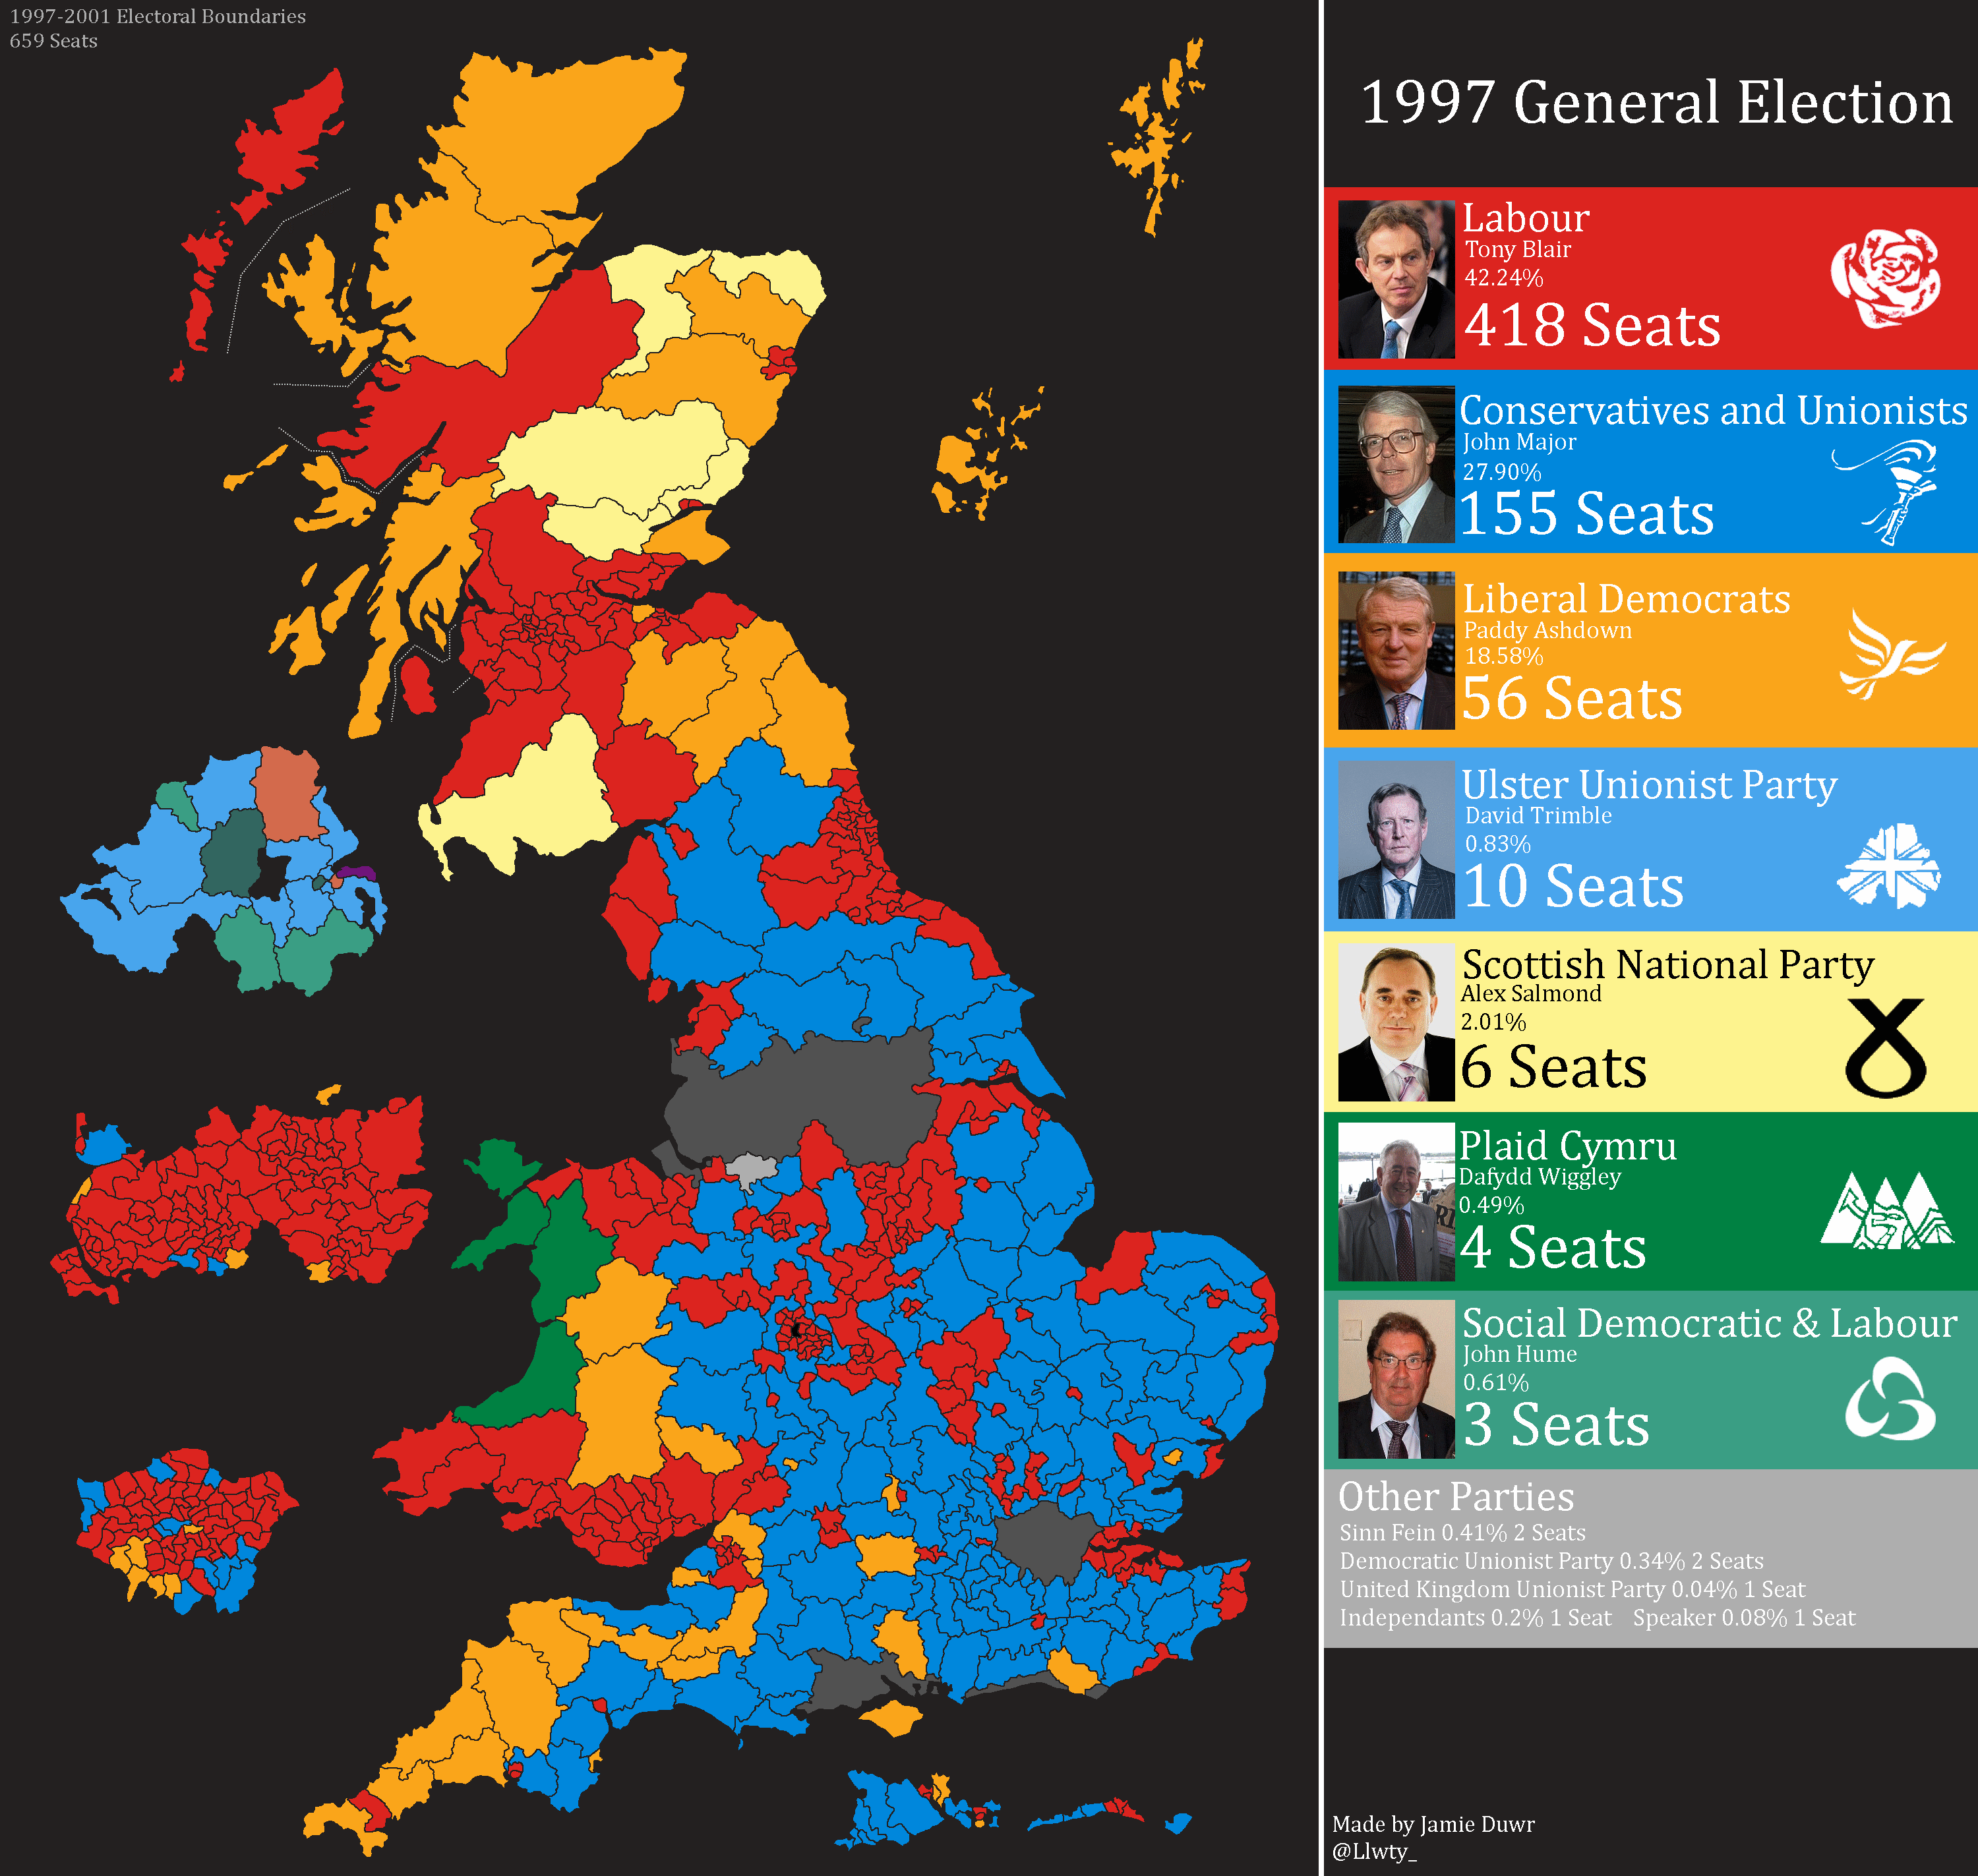
1997 General Election
| Party |
Leader |
Seats |
Change |
Popular Vote % |
Change |
| Labour |
Tony Blair |
418 |
+145 |
42.24% |
+7.9% |
| Conservatives |
John Major |
155 |
-211 |
27.90% |
-14.0% |
| Liberal Democrats |
Paddy Ashdown |
56 |
+36 |
18.58% |
+0.8% |
| UUP |
David Trimble |
10 |
+1 |
0.83% |
+0.0% |
| SNP |
Alex Salmond |
6 |
+3 |
2.01% |
+0.1% |
| Plaid Cymru |
Dafydd Wiggley |
4 |
+0 |
0.49% |
+0.0% |
| SDLP |
John Hume |
3 |
-1 |
0.61% |
+0.1 |
| Other |
|
7 |
|
1.07% |
|
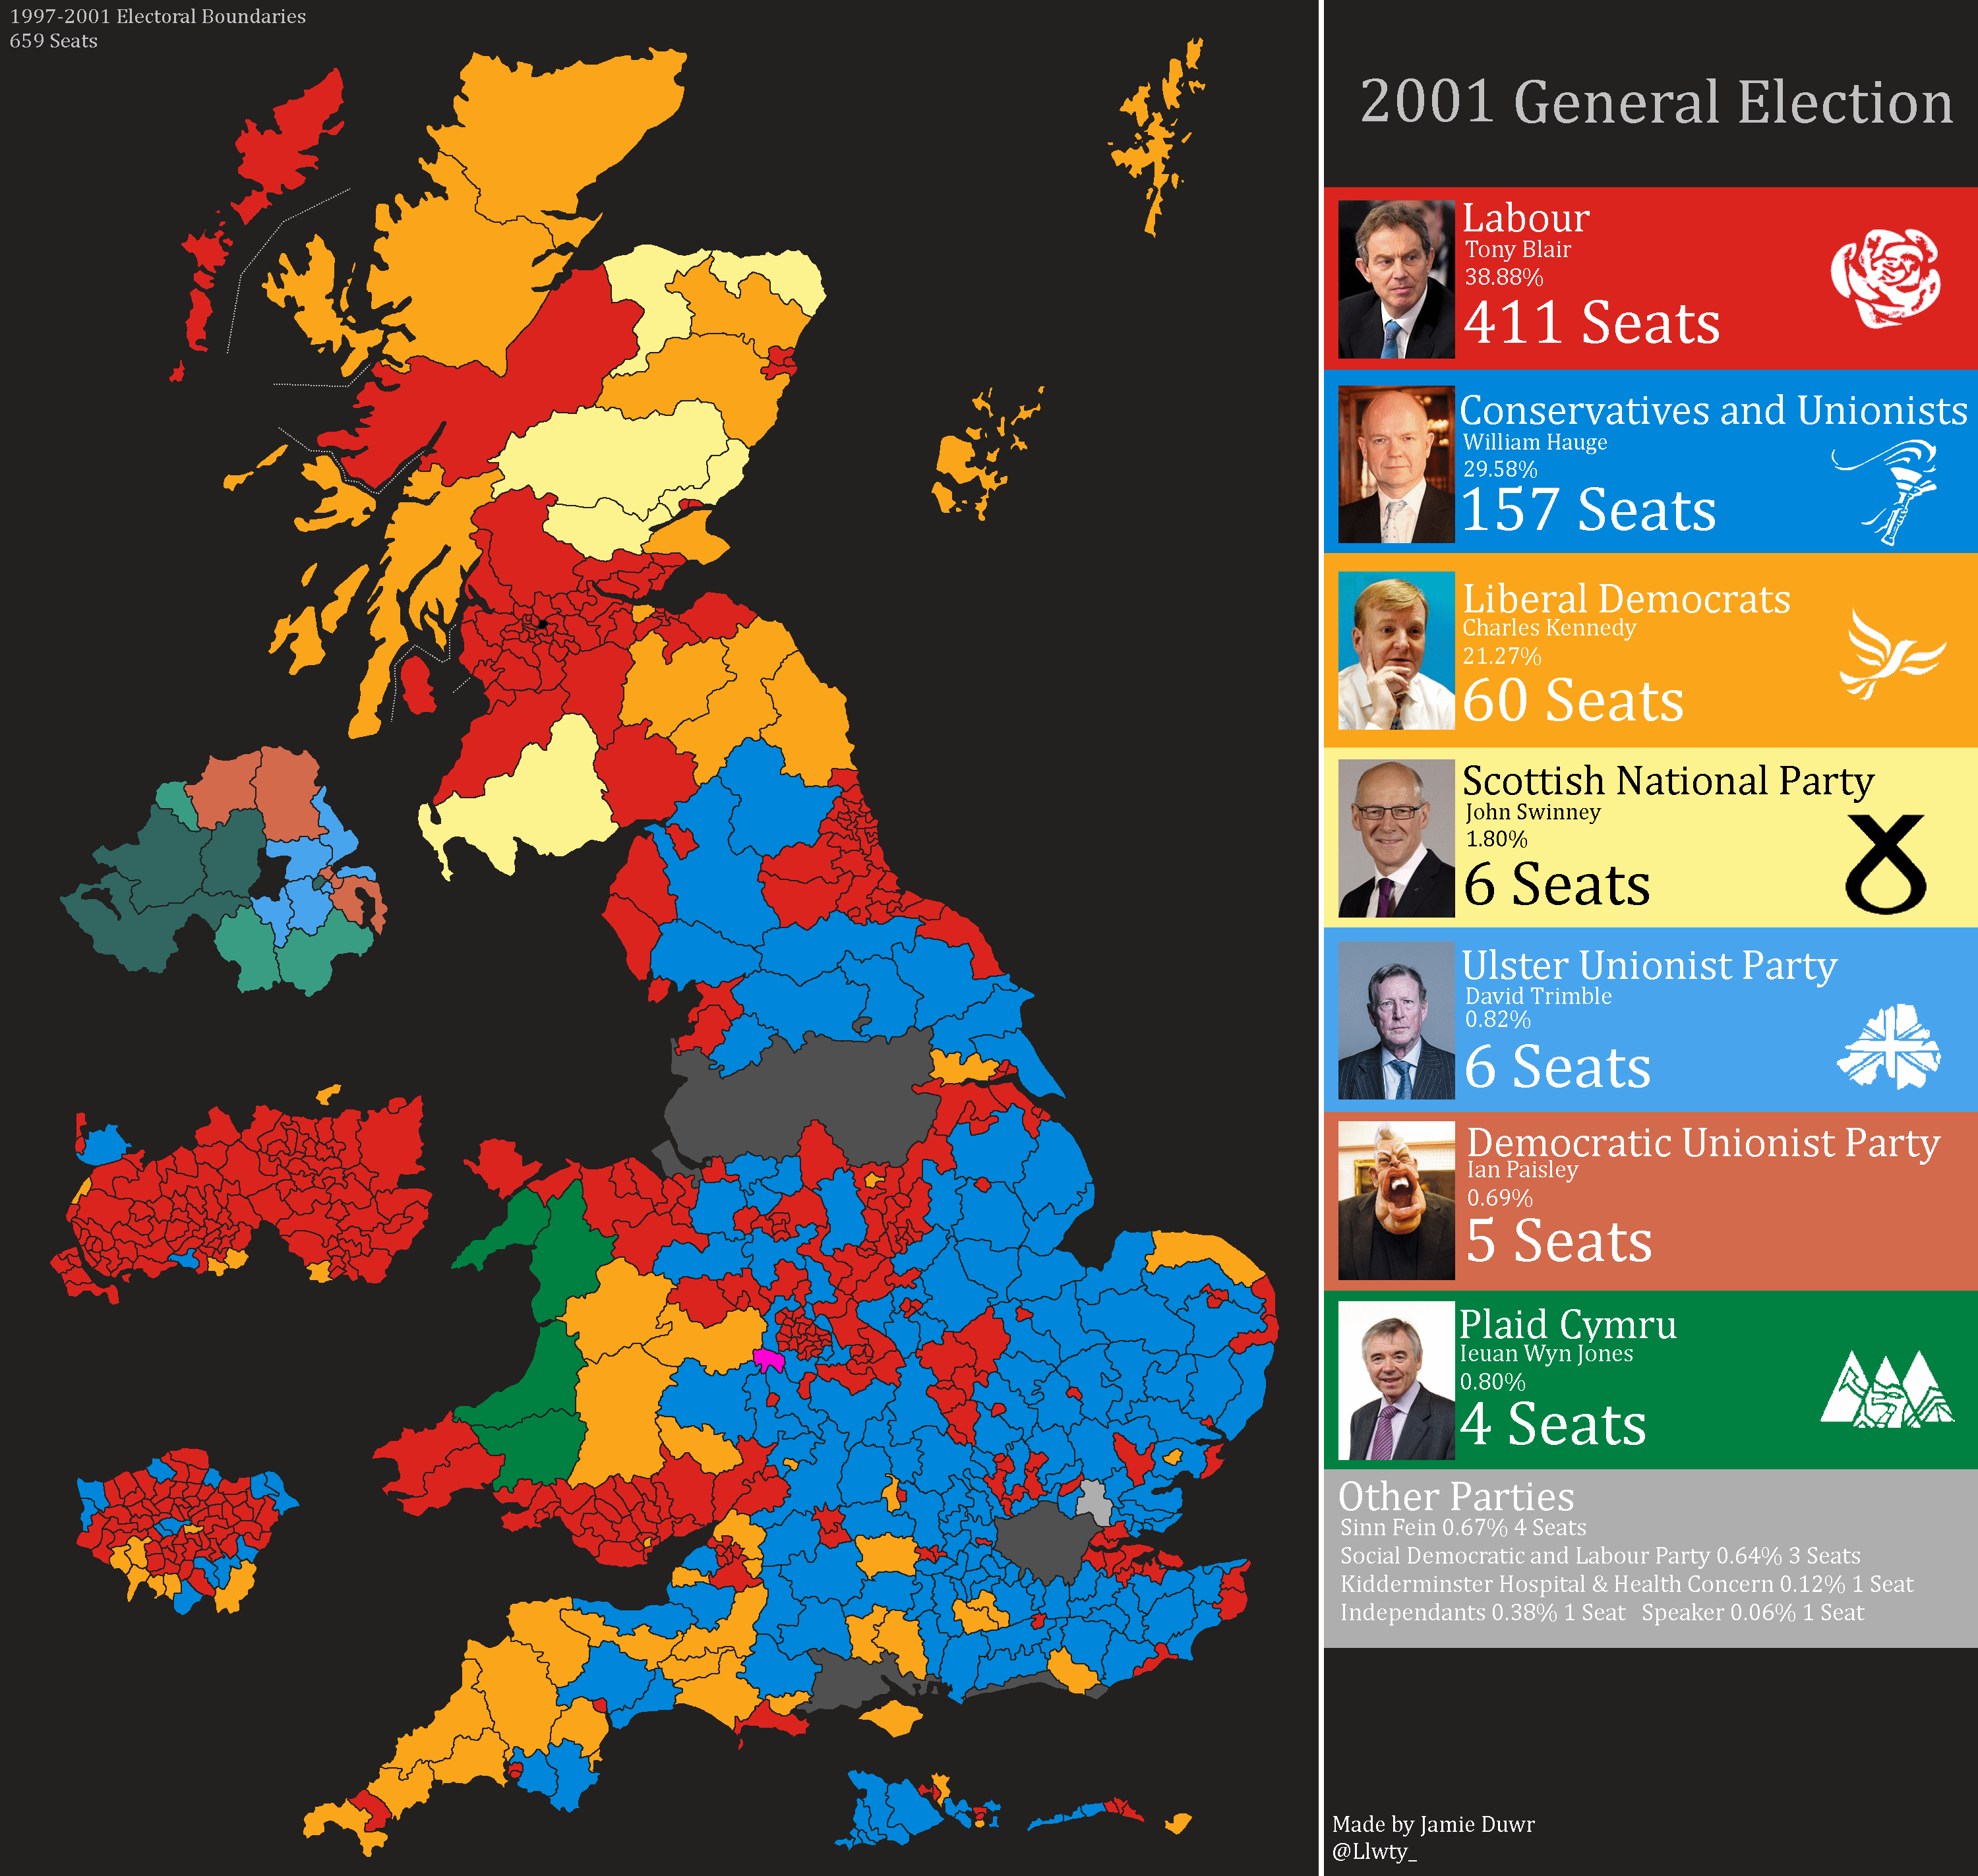
2001 General Election
| Party |
Leader |
Seats |
Change |
Popular Vote % |
Change |
| Labour |
Tony Blair |
411 |
-7 |
38.88% |
-3.36% |
| Conservatives |
William Hauge |
157 |
+2 |
29.58% |
+1.68% |
| Liberal Democrats |
Charles Kennedy |
60 |
+4 |
21.27% |
+2.69% |
| SNP |
John Swinney |
6 |
+0 |
1.80% |
+0.97% |
| UUP |
David Trimble |
6 |
+3 |
0.82/td>
| -0.11% |
| DUP |
Ian Paisley |
5 |
+3 |
0.69% |
+0.28% |
| Plaid Cymru |
Dafydd Wiggley |
4 |
+0 |
0.80 |
+0.31 |
| Other |
|
10 |
|
1.87% |
|
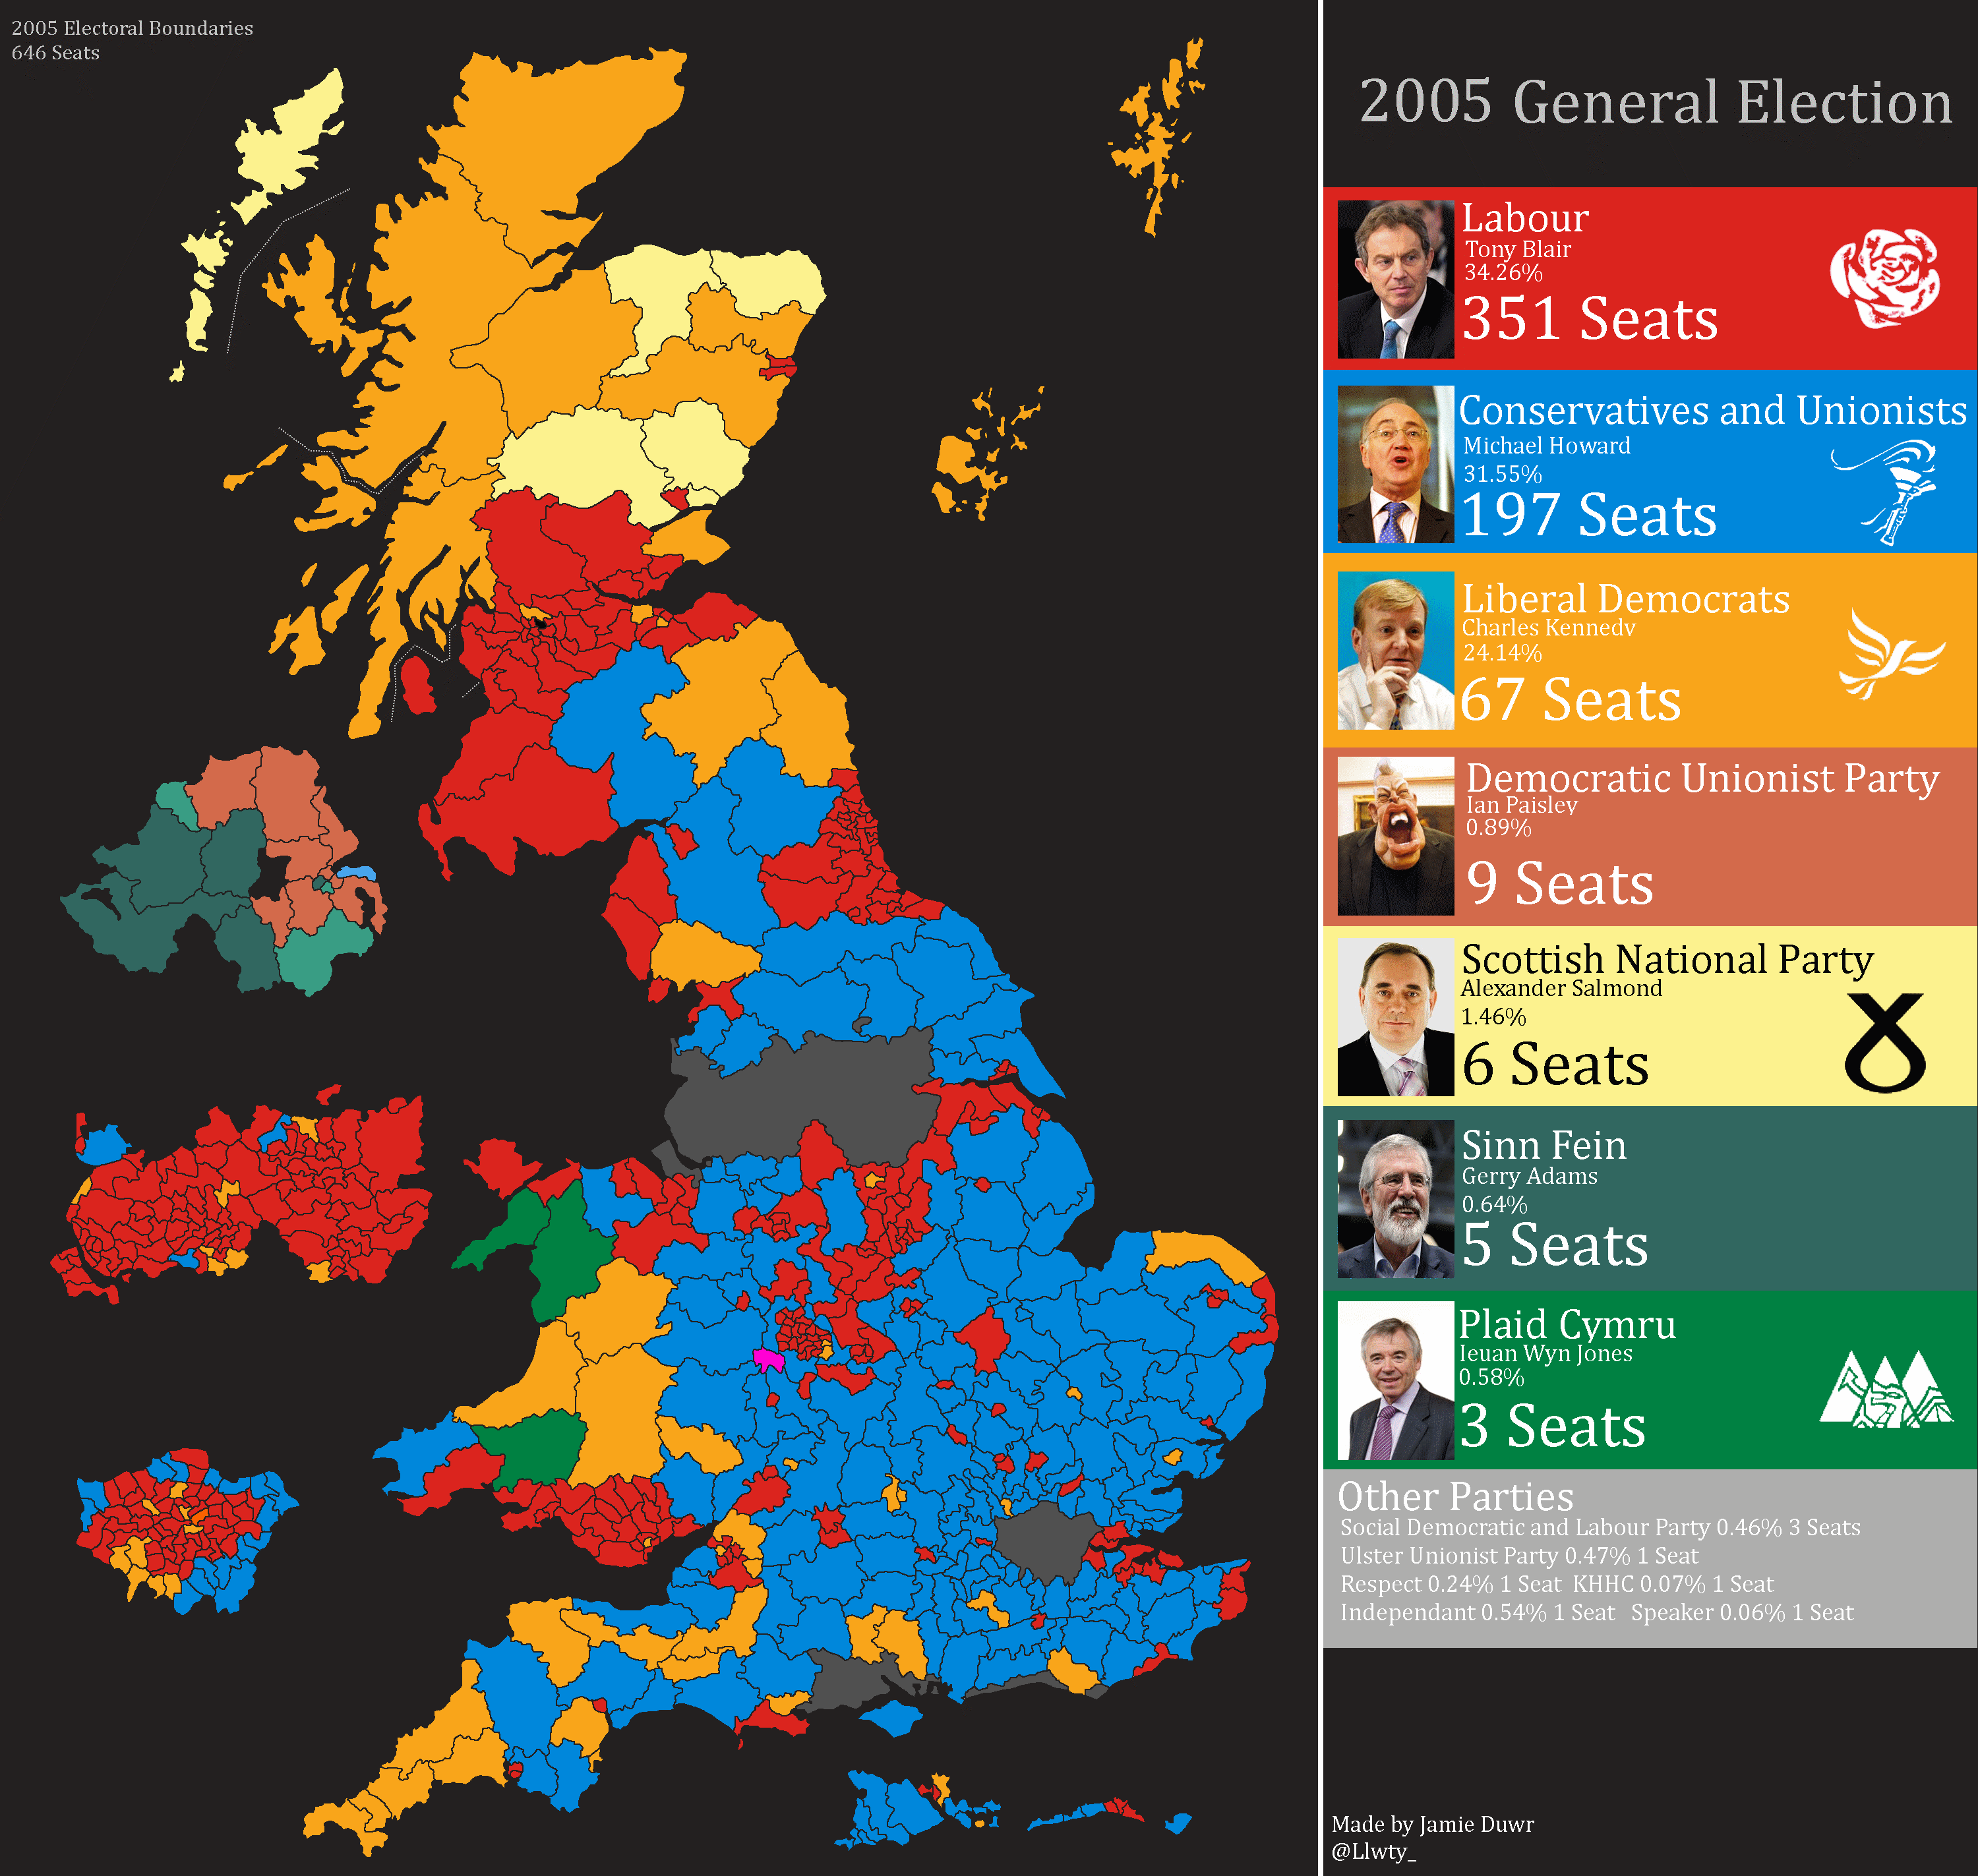
2005 General Election
| Party |
Leader |
Seats |
Change |
Popular Vote % |
Change |
| Labour |
Tony Blair |
351 |
-60 |
34.26% |
+4.62% |
| Conservatives |
Michael Howard |
197 |
+40 |
31.55% |
+1.97% |
| Liberal Democrats |
Paddy Ashdown |
67 |
+7 |
24.14% |
+2.87% |
| DUP |
Ian Paisley |
9 |
+4 |
0.89% |
+0.2% |
| SNP |
Alex Salmond |
6 |
+3 |
1.46% |
-0.34% |
| Sinn Fein |
Gerry Adams |
5 |
+1 |
0.64% |
-0.2% |
| Plaid Cymru |
Ieuan Wyn Jones |
3 |
-1 |
0.58% |
-0.22 |
| Other |
|
8 |
|
1.84% |
|
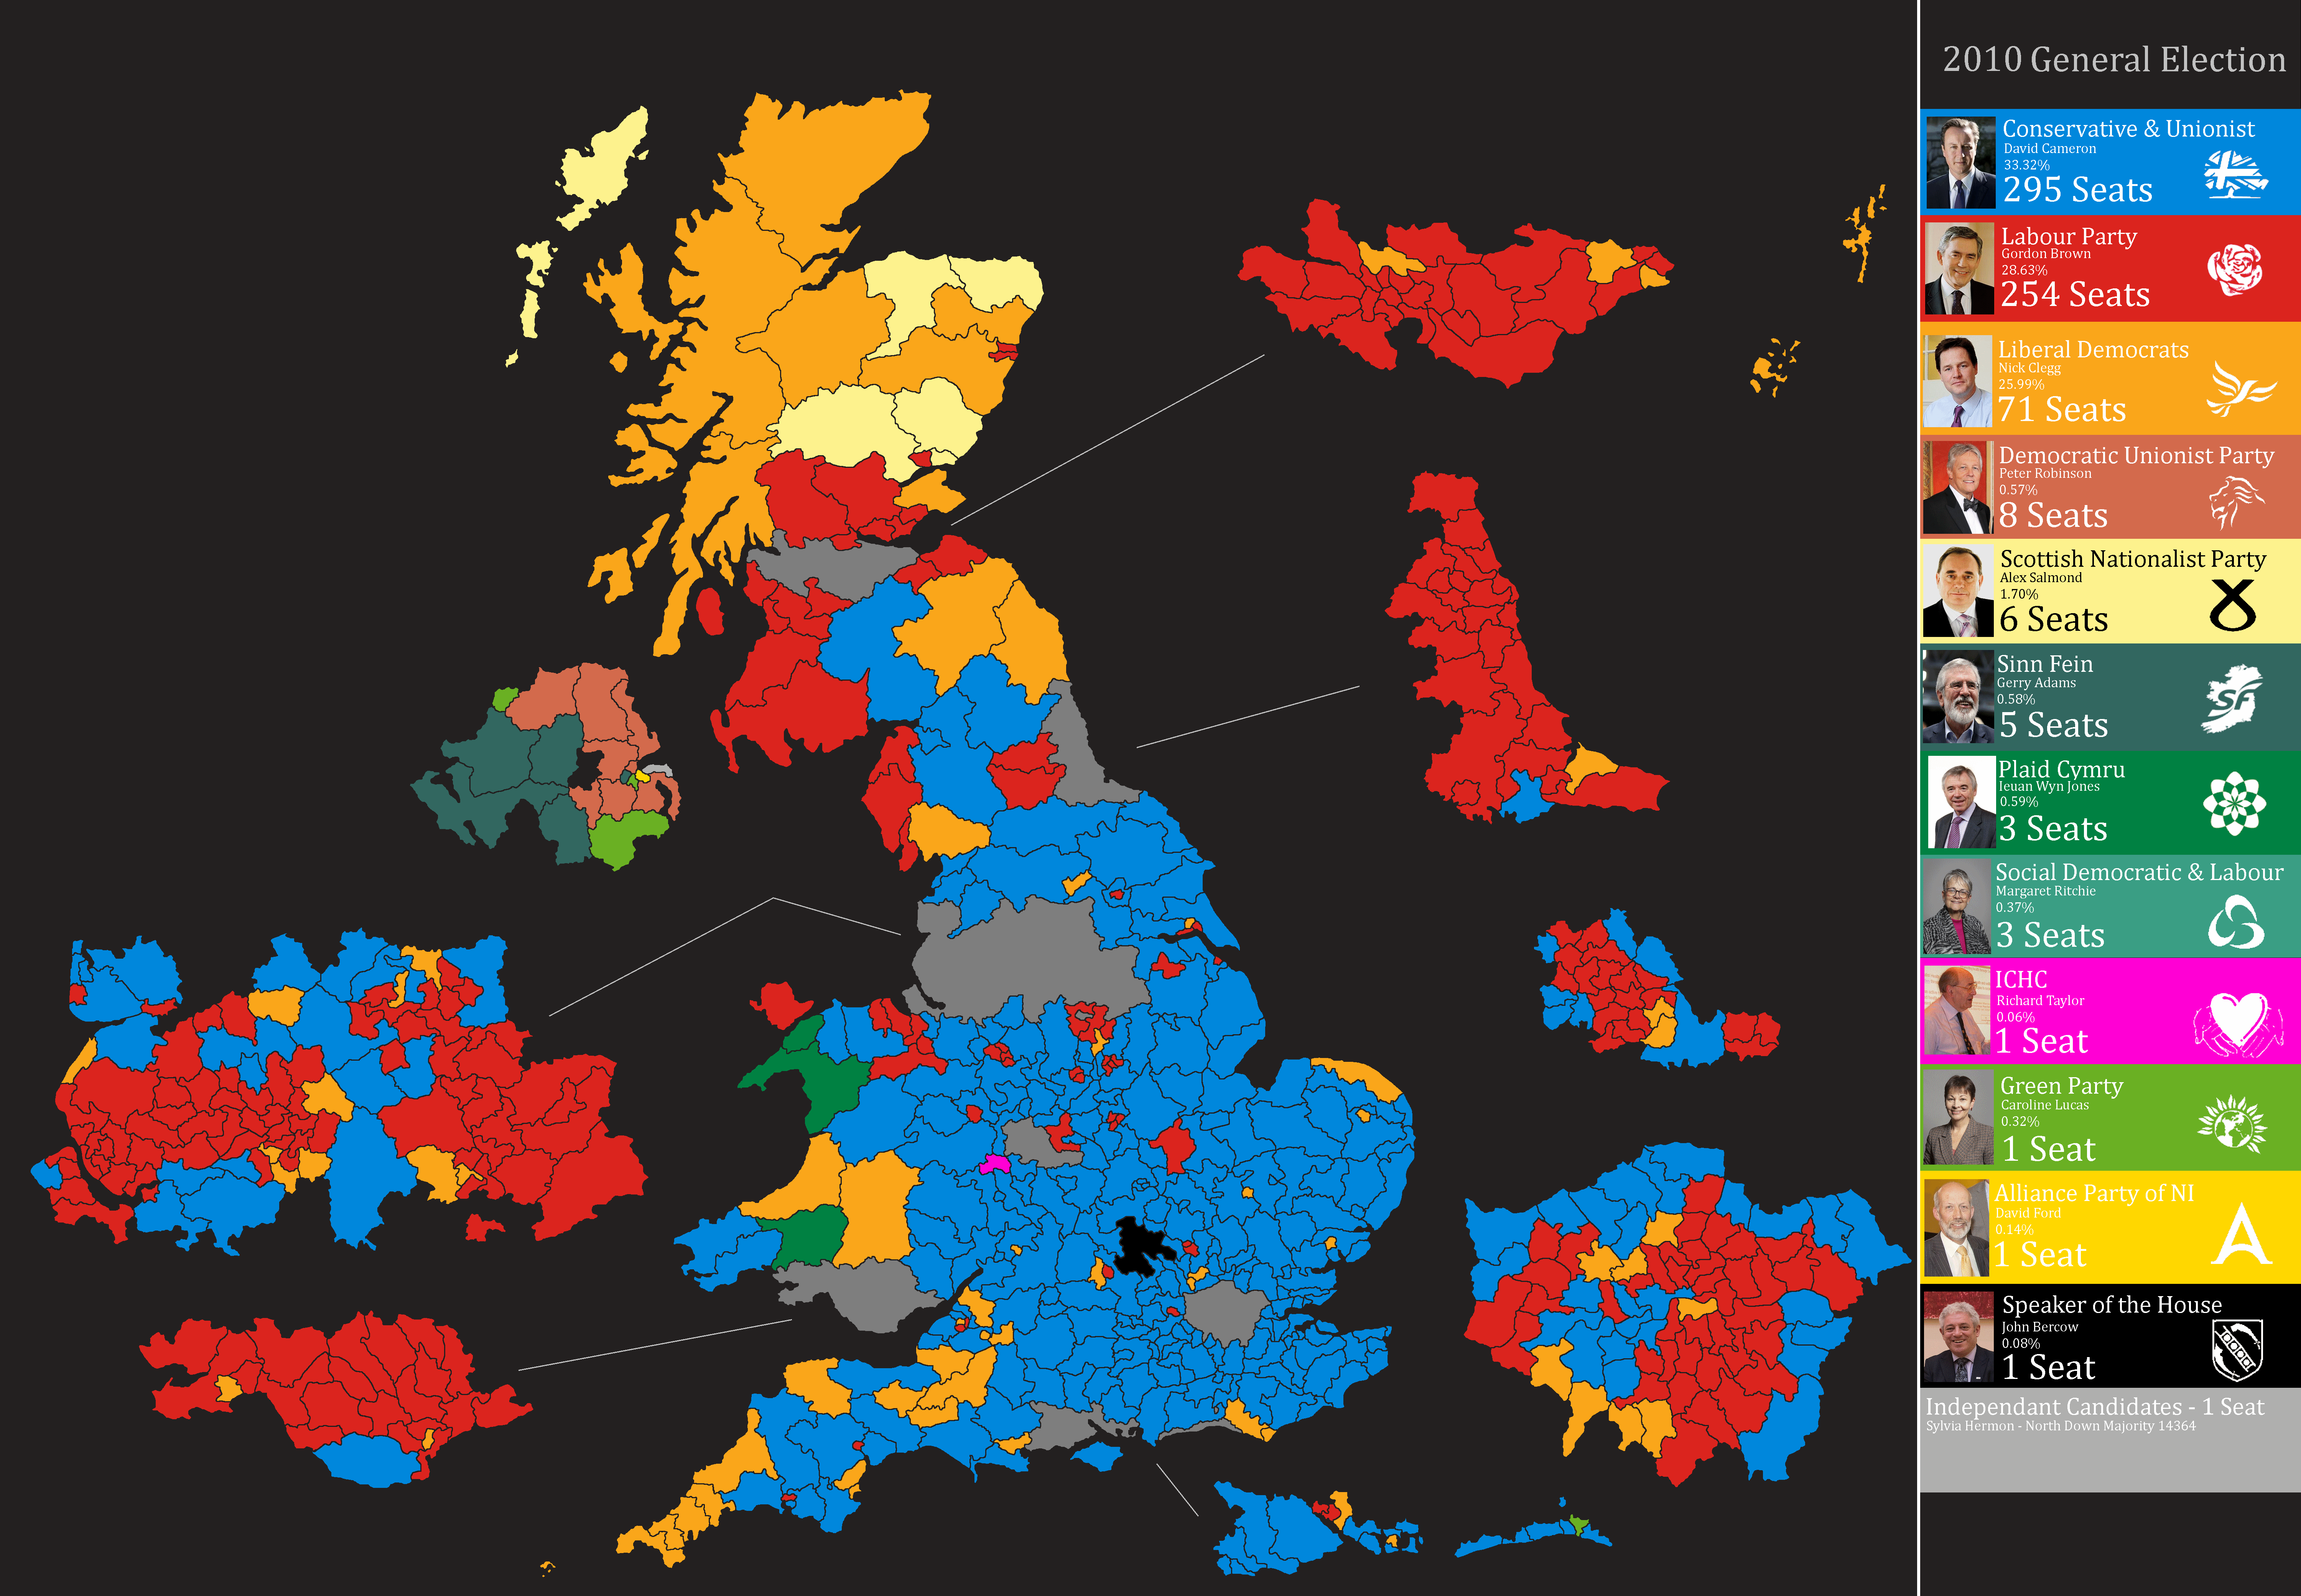
2010 General Election
| Party |
Leader |
Seats |
Change |
Popular Vote % |
Change |
| Conservatives |
David Cameron |
295 |
+98 |
33.32% |
+1.77% |
| Labour |
Gordon Brown |
254 |
-97 |
28.63% |
-5.63% |
| Liberal Democrats |
Nick Clegg |
71 |
+4 |
25.99 |
+1.85% |
| DUP |
Peter Robinson |
8 |
-1 |
0.89% |
+0.2% |
| SNP |
Alex Salmond |
6 |
+0 |
1.70% |
+0.24% |
| Sinn Fein |
Gerry Adams |
5 |
+0 |
0.58% |
-0.06% |
| Plaid Cymru |
Ieuan Wyn Jones |
3 |
+0 |
0.59% |
+0.01 |
| Other |
|
8 |
|
2% |
|
2011 General Election
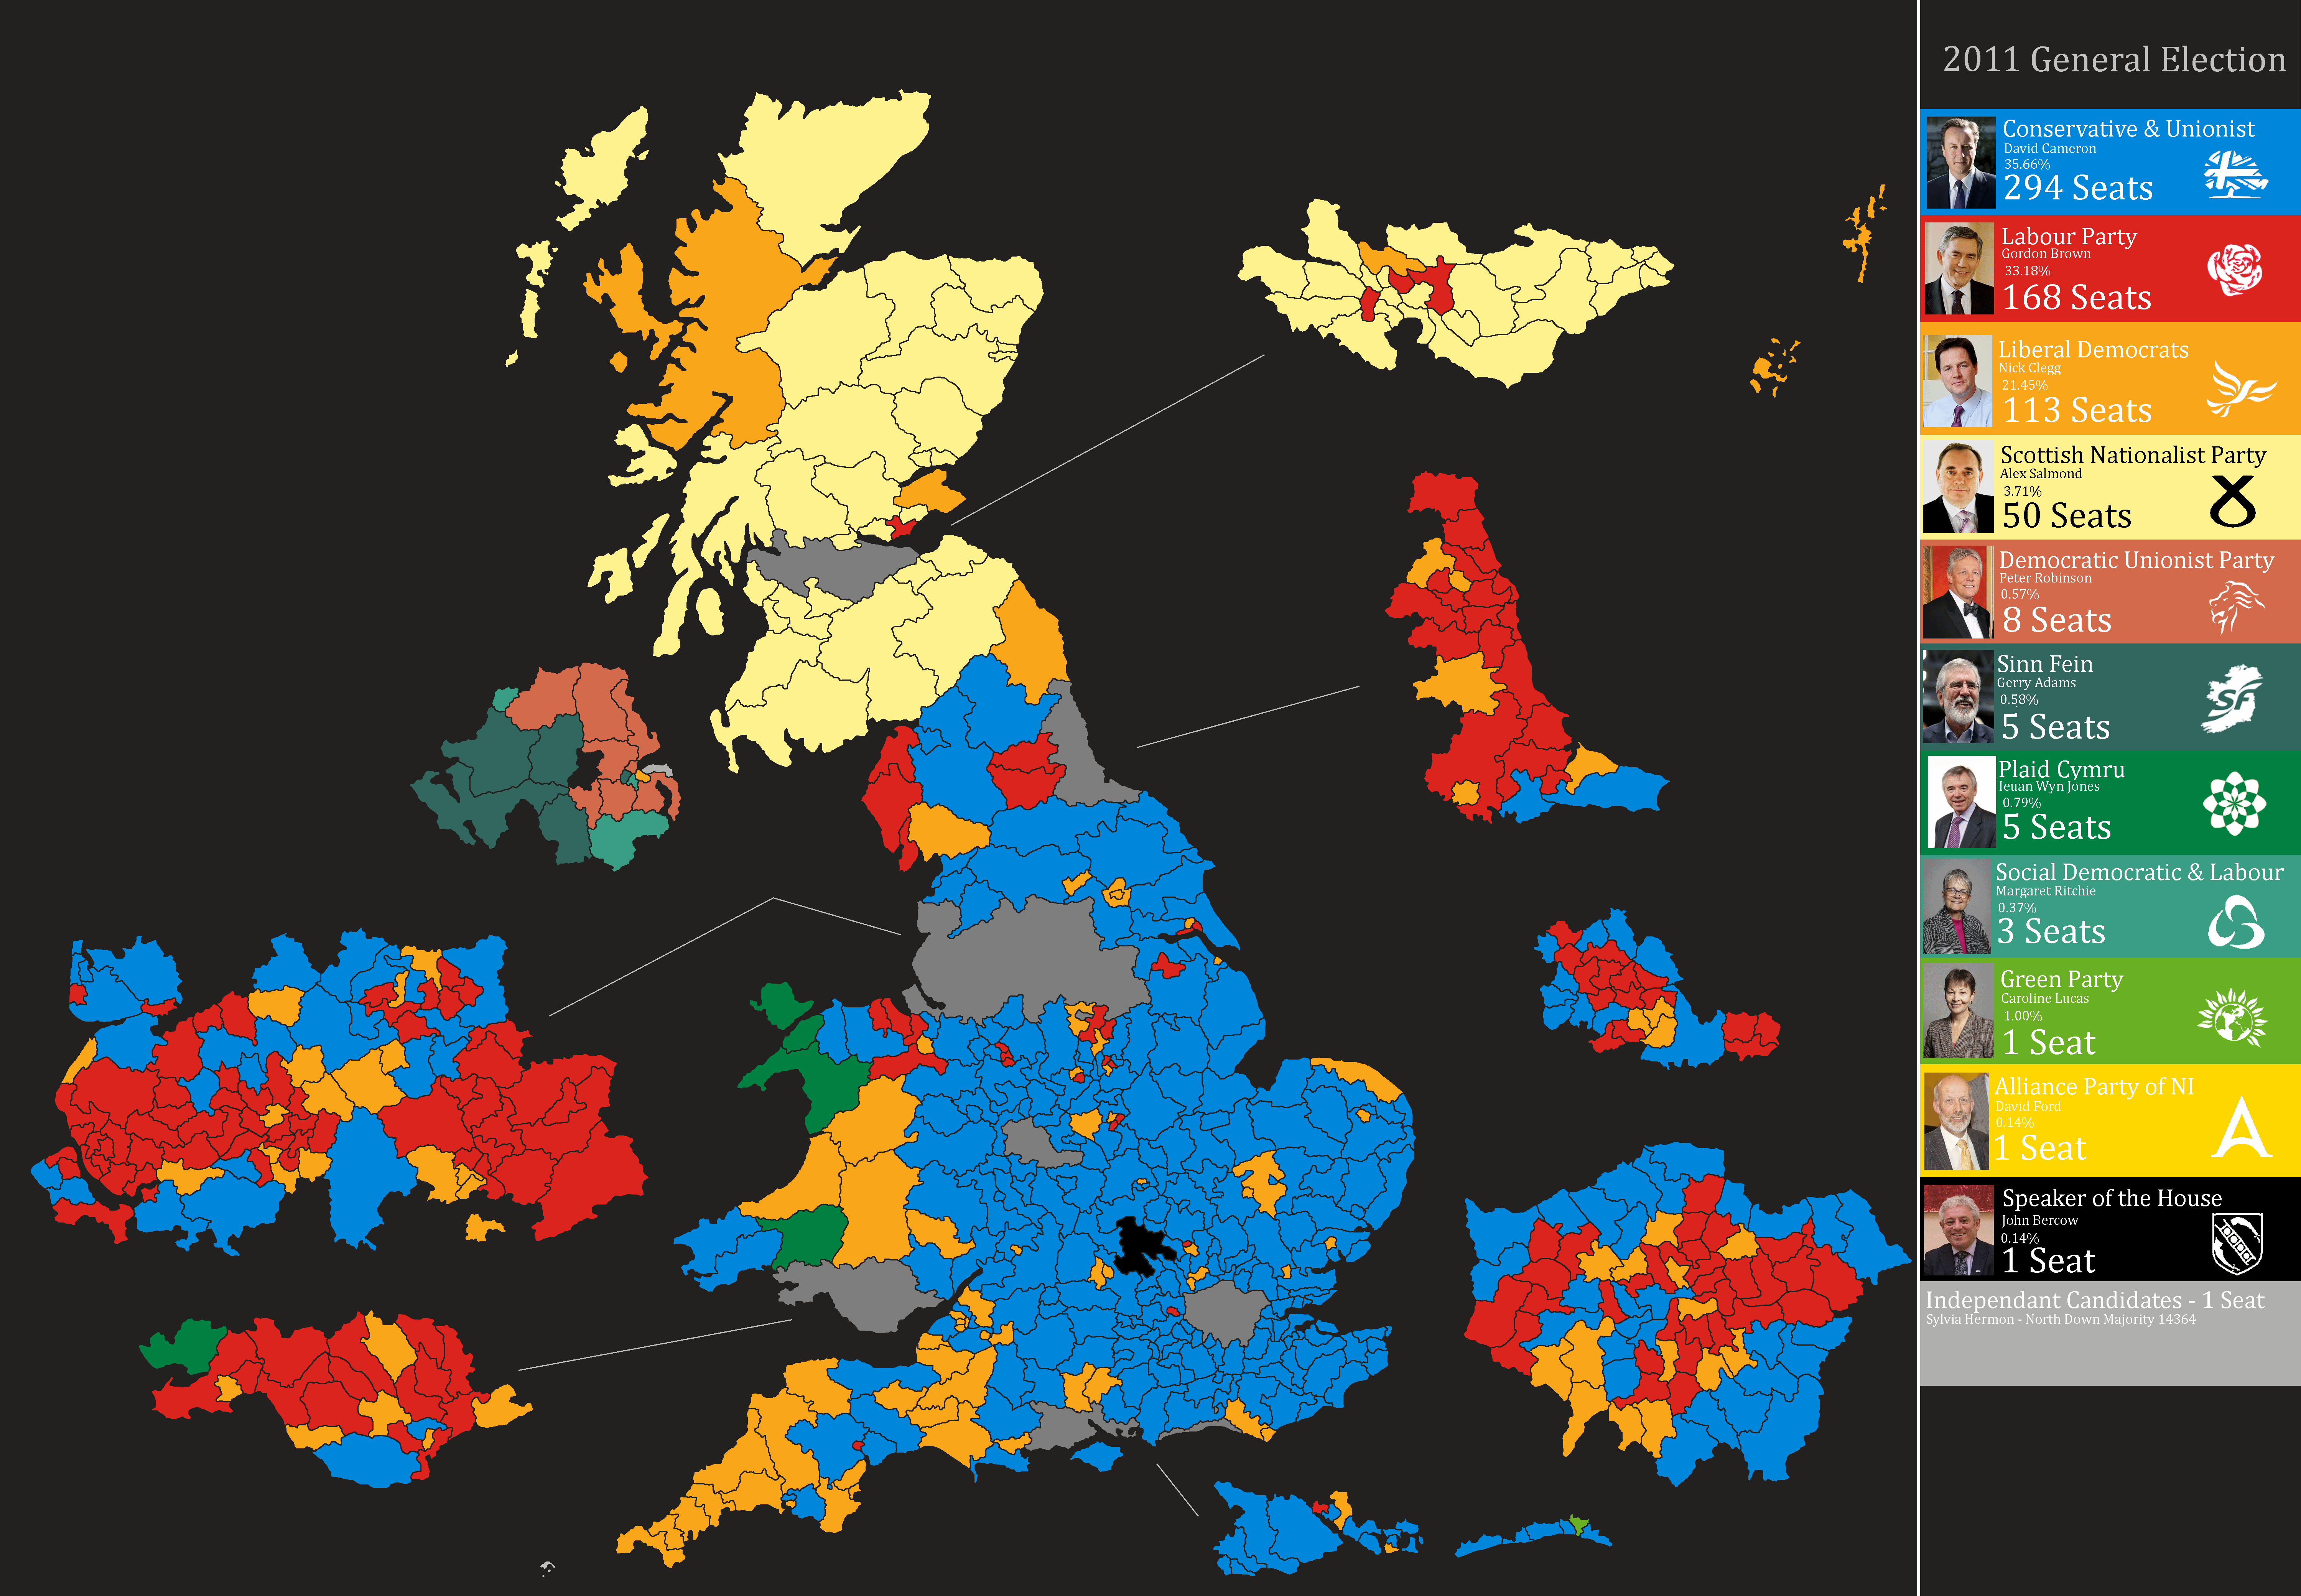
| Party |
Leader |
Seats |
Change |
Popular Vote % |
Change |
| Conservatives |
David Cameron |
294 |
-1 |
35.66% |
+2.34% |
| Labour |
Gordon Brown |
168 |
-86 |
33.18% |
+4.55% |
| Liberal Democrats |
Nick Clegg |
113 |
+42 |
21.45% |
-4.54% |
| SNP |
Alex Salmond |
50 |
+46 |
3.71% |
+2.01% |
| DUP |
Peter Robinson |
8 |
+0 |
0.57% |
-0.32% |
| Sinn Fein |
Gerry Adams |
5 |
+0 |
0.58% |
+0.0%% |
| Plaid Cymru |
Ieuan Wyn Jones |
5 |
+2 |
0.79% |
+0.2% |
| Other |
|
7 |
|
2% |
|
2011 Labour Party Leadership Election
| Candidate |
Round 1 |
Round 2 |
Round 3 |
Round 4 |
| Ed Miliband |
34.3% |
37.5% |
41.3% |
50.7% |
| David Miliband |
37.8% |
38.9% |
42.7% |
49.3% |
| Ed Balls |
11.8% |
13.2% |
16.0% |
X |
| Andy Burnham |
8.7% |
10.4% |
X |
| Dianne Abbot |
7.4% |
X |
Ed Miliband elected Leader of the Labour Party
2014 Liberal Democrat Leadership Election
| Candidate |
Vote |
| Tim Farron |
19,137 |
| Norman Lamb |
14,760 |
Tim Farron elected Leader of the Liberal Democrats
2016 General Election
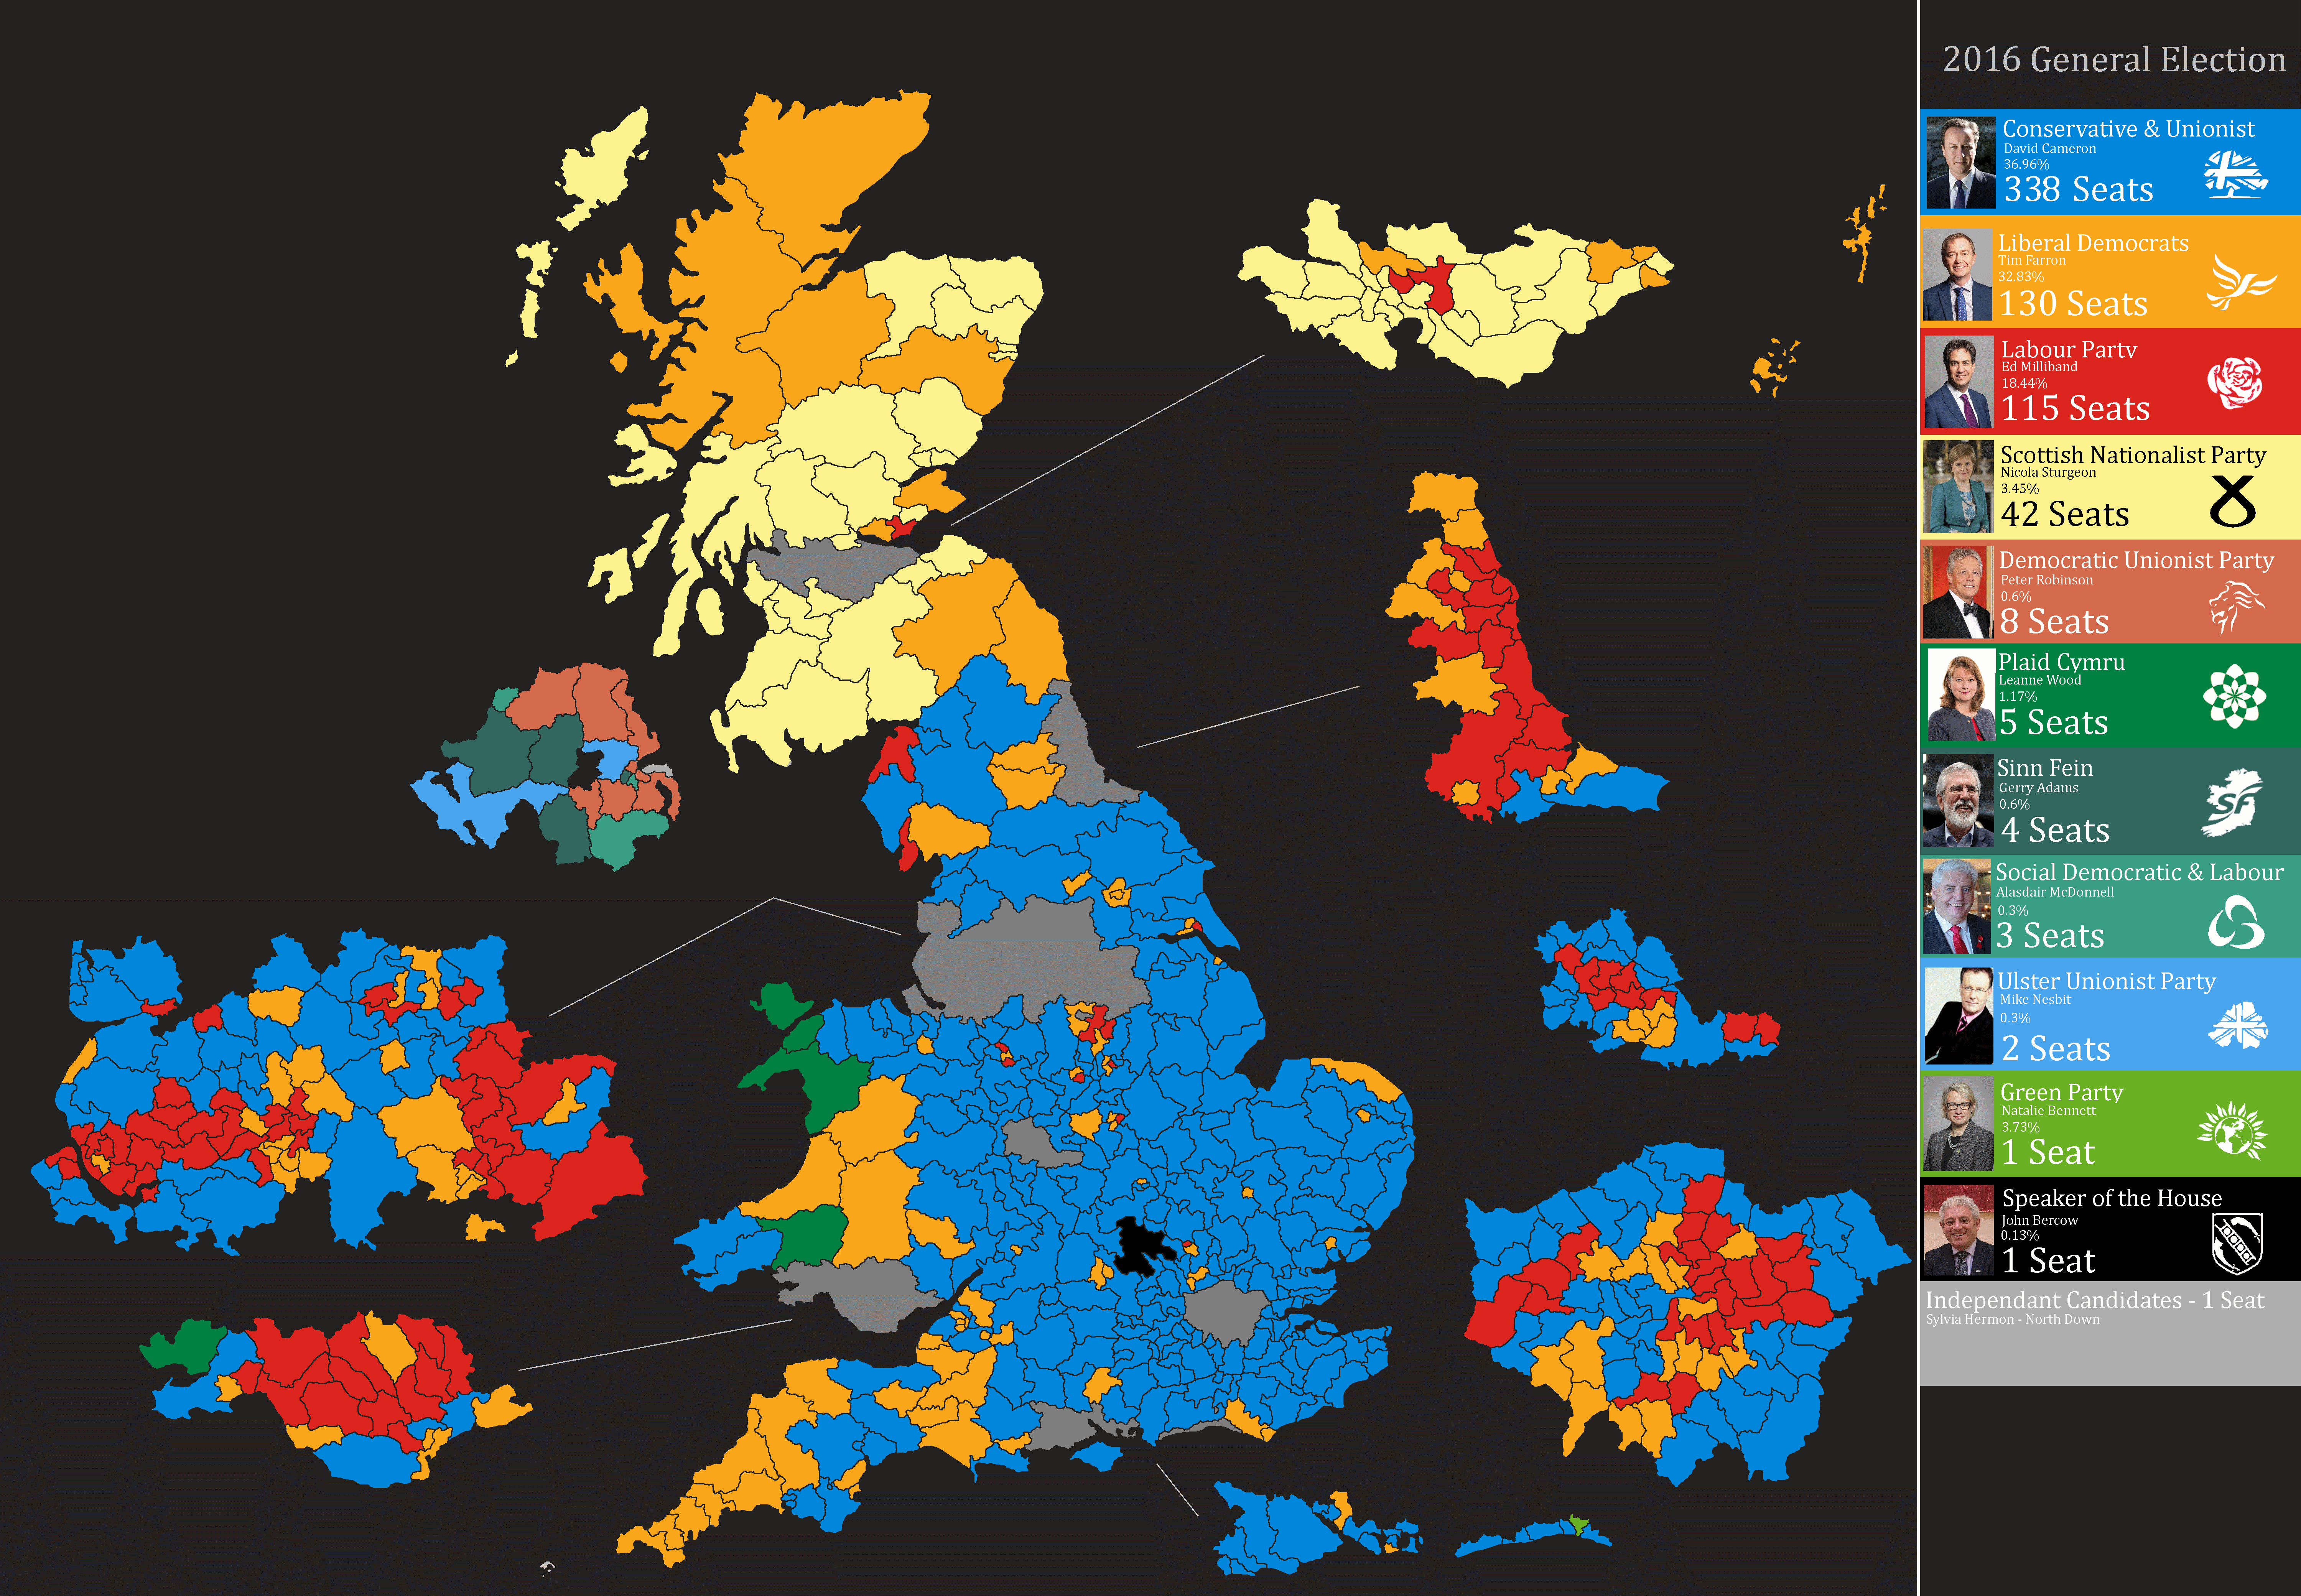
| Party |
Leader |
Seats |
Change |
Popular Vote % |
Change |
| Conservatives |
David Cameron |
338 |
+44 |
36.96% |
+1.30% |
| Liberal Democrats |
Tim Farron |
130 |
+17 |
21.45% |
-4.54% |
| Labour |
Ed Milliband |
115 |
-53 |
18.44% |
-14.74% |
| SNP |
Nicola Sturgeon |
42 |
-8 |
3.45% |
-0.26% |
| DUP |
Peter Robinson |
8 |
+0 |
0.6% |
+0.3% |
| Sinn Fein |
Gerry Adams |
4 |
-1 |
0.6% |
+0.02%% |
| Plaid Cymru |
Leanne Wood |
5 |
+0 |
1.17% |
+0.39% |
| Other |
|
8 |
|
4% |
|
2020 Conservative Party Leadership Election
Note: Only 329 Conervatives MPs remained by 2020 due to By-Elections
| Candidate |
Round 1 |
Round 2 |
Membership Vote |
| Theresa May |
111 |
120 |
79,221 |
| George Osborne |
114 |
122 |
60,304 |
| Boris Johnson |
54 |
87 |
X |
| Michael Gove |
50 |
X |
Theresa May elected Conservative Party Leader
2021 General Election
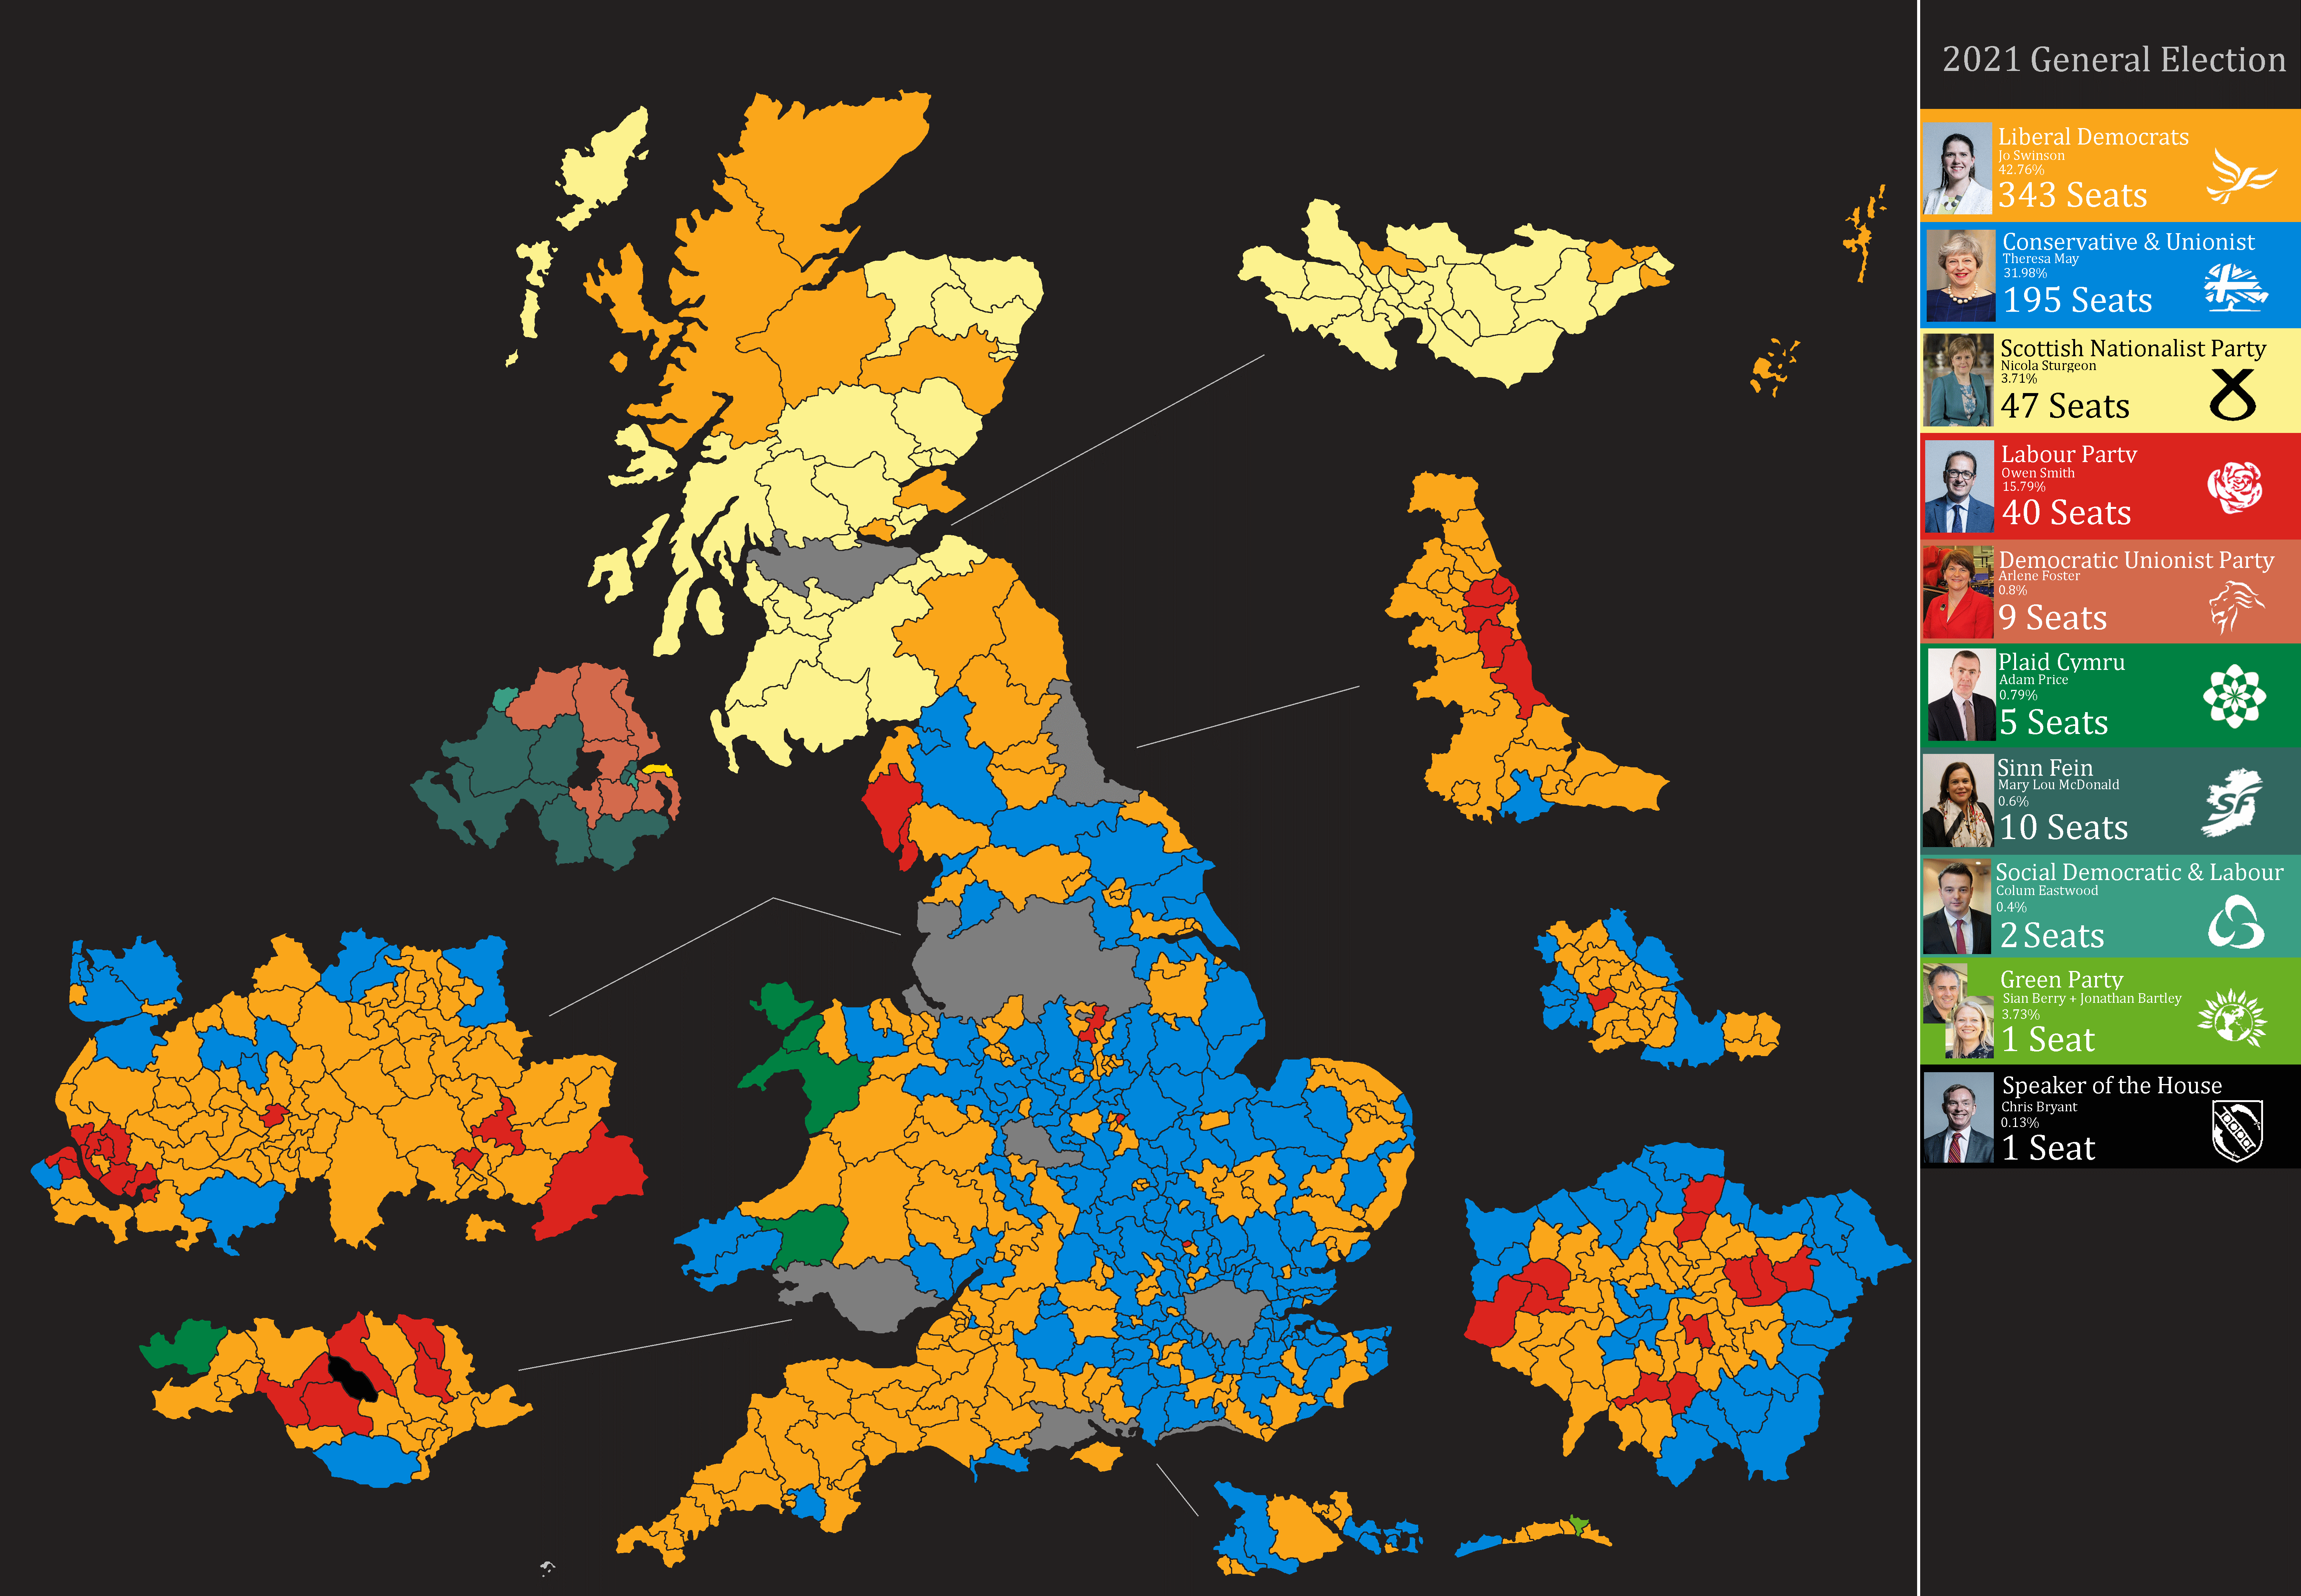
| Party |
Leader |
Seats |
Change |
Popular Vote % |
Change |
| Liberal Democrats |
Jo Swinson |
343 |
+230 |
42.76 |
+21.31% |
| Conservatives |
Theresa May |
195 |
-143 |
31.98% |
-4.98% |
| SNP |
Nicola Sturgeon |
47 |
+5 |
3.71% |
+0.26% |
| Labour |
Owen Smith |
40 |
-53 |
18.44% |
-14.74% |
| Sinn Fein |
Mary Lou McDonald |
10 |
+6 |
0.6% |
+0.02%% |
| DUP |
Arlene Foster |
8 |
+0 |
0.6% |
+0.0% |
| Plaid Cymru |
Adam Price |
5 |
+0 |
0.79% |
-0.38% |
| Other |
|
4 |
|
4.87% |
|
Owen Smith lost his seat to the Liberal Democrats